Lose weight while enjoying it: the sweet secret to losing weight
Author:
Julio Valero
Published on:
1/30/2025

Association of low- and no-calorie sweetened beverages as a replacement for sugary drinks with body weight and cardiometabolic risk: a systematic review and meta-analysis
Are you one of those who enjoy a soft drink or juice, but want to lose weight? We have important information for you!
Overview
A network meta-analysis examined how consumption of water, diet beverages, and sugar-sweetened beverages relates to body weight and various indicators of cardiovascular and metabolic health.
Replacing sugary drinks with diet options was associated with modest improvements in weight and some cardiometabolic risk factors, compared with water and sugary drinks.
If your goal is to lose weight, switching from soda and sugary drinks to diet options can go a long way toward cutting calories.
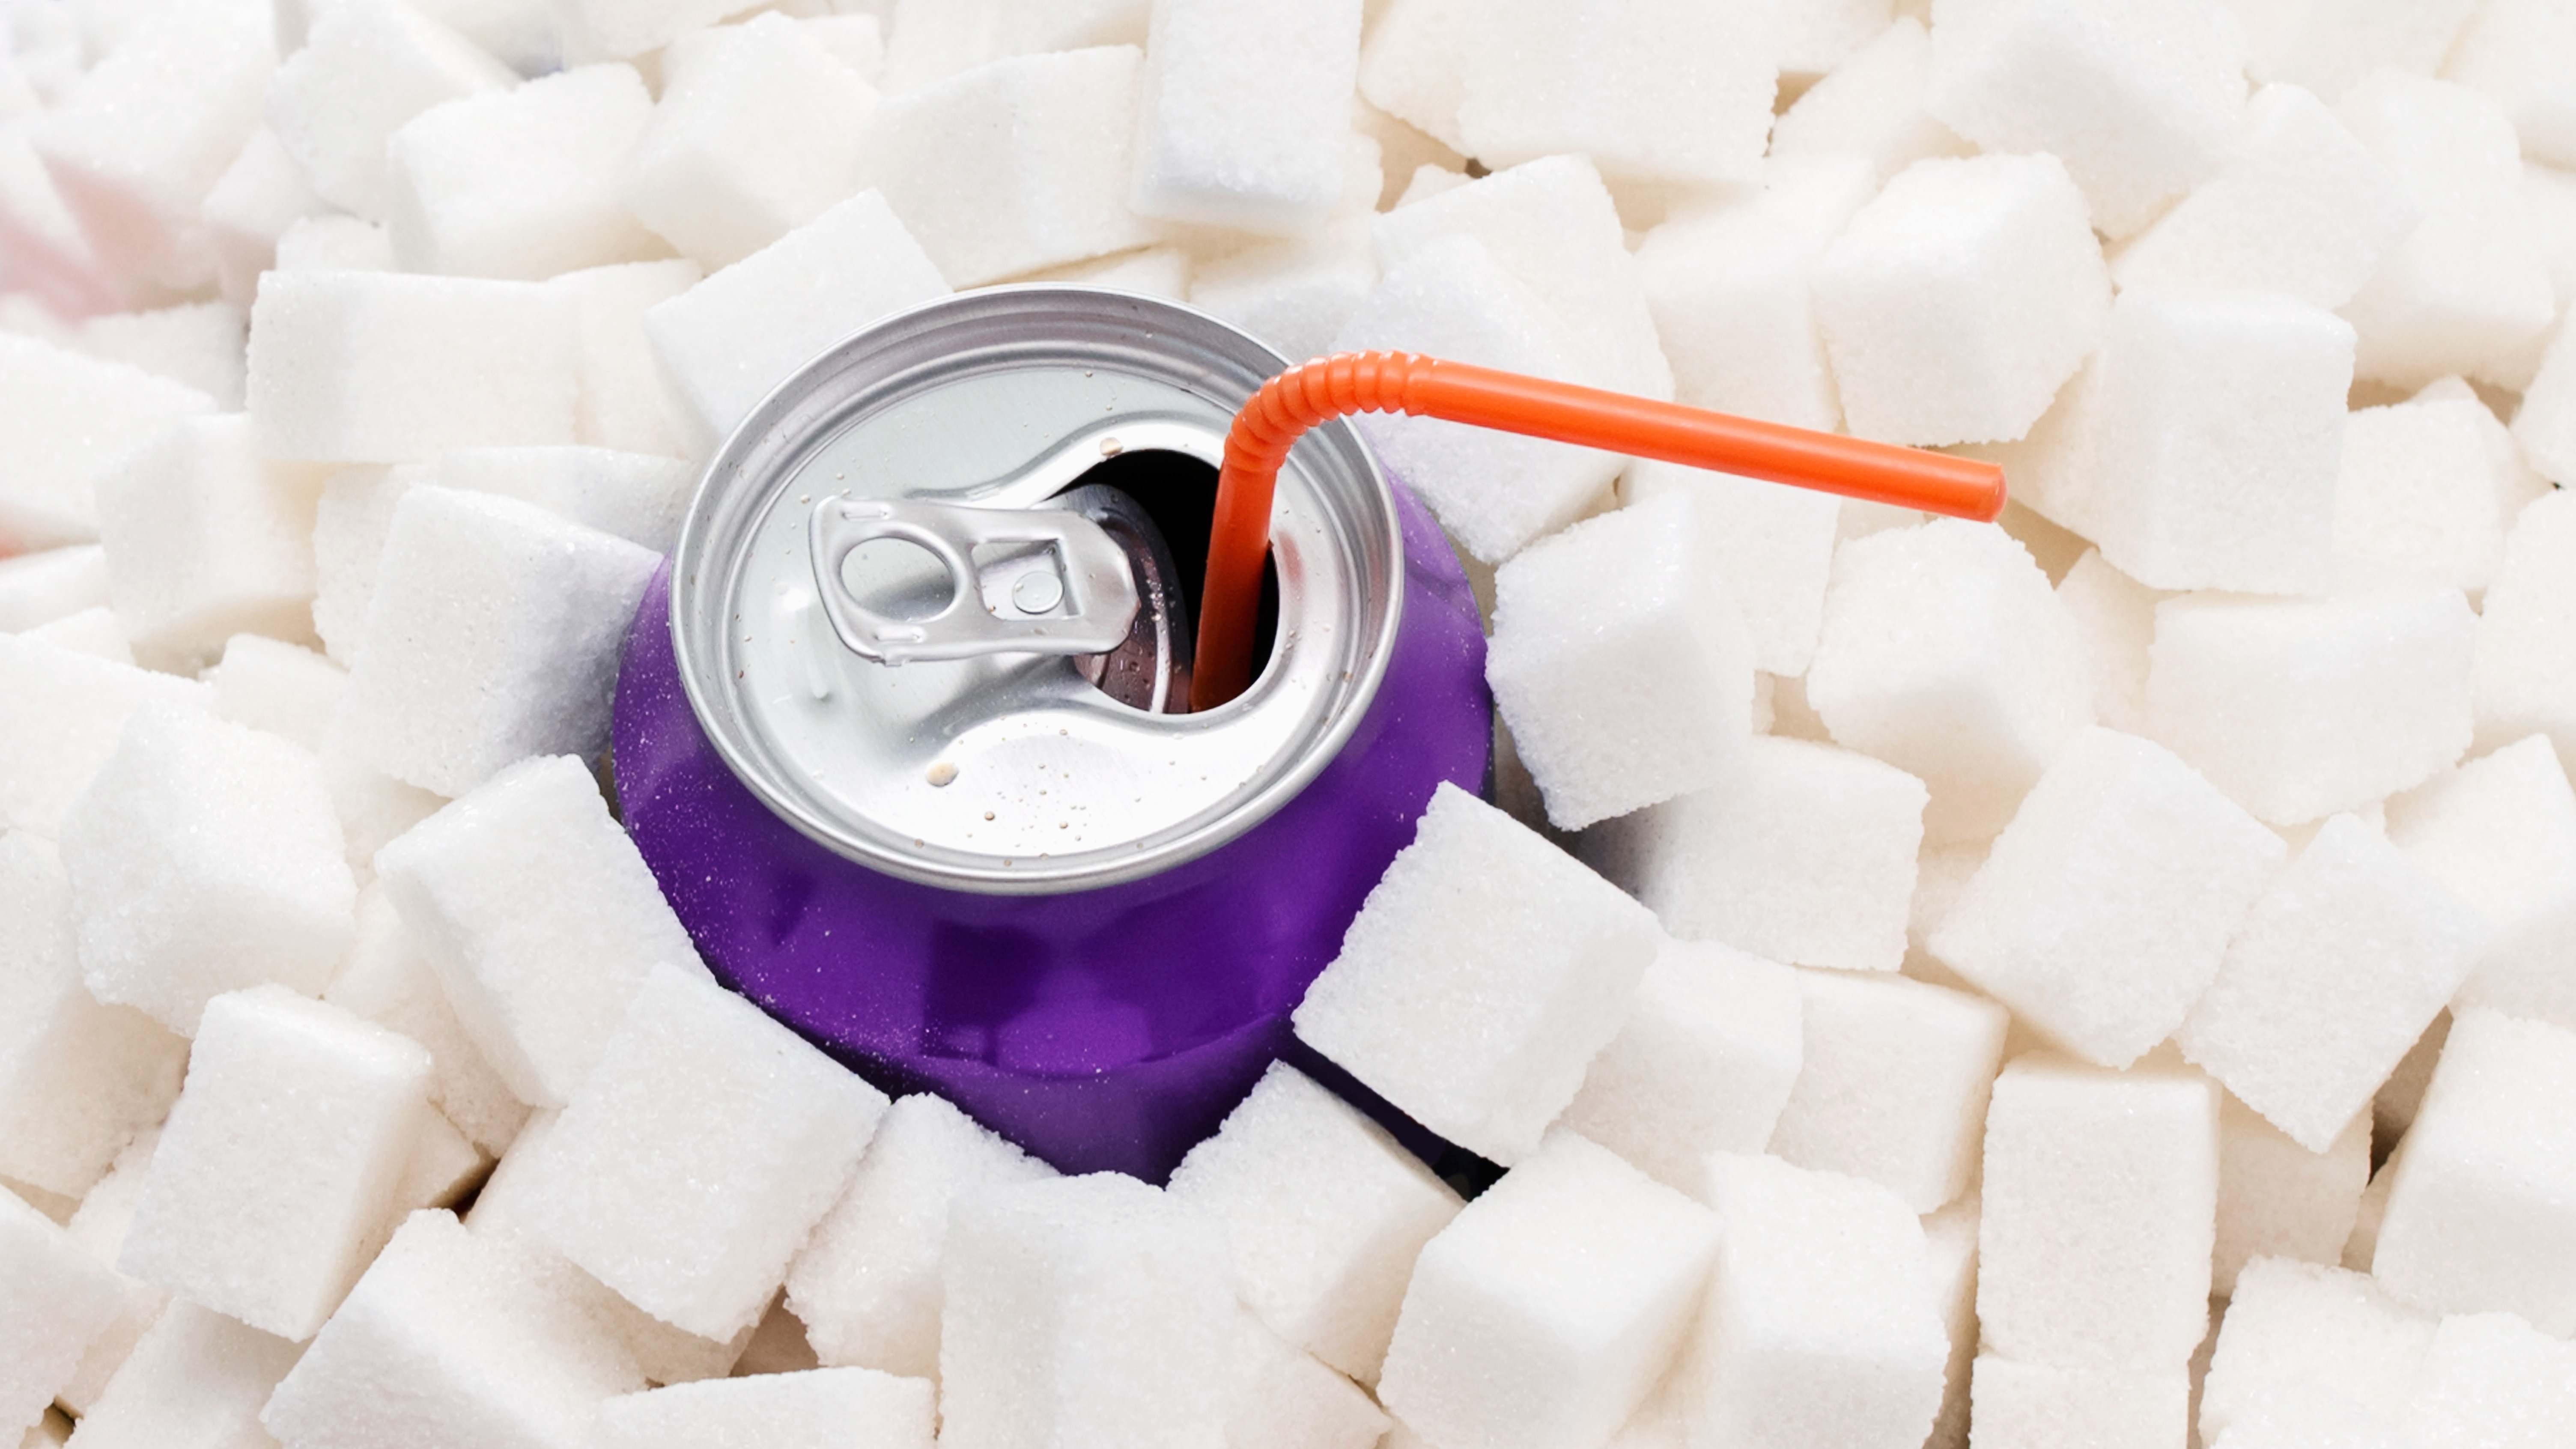
What's the problem?
Obesity is a complex problem with multiple causes, though certain nutrients are often unfairly blamed. Sugar, in particular, has been the subject of controversy, being labeled as addictive without solid evidence. However, soda and other sugary drinks are a common fixture in many cultures. Added sugar is a common ingredient in many foods and beverages. Unfortunately, it is also a major source of calories that can contribute to weight gain. A popular strategy for losing fat is to reduce the consumption of liquid calories, such as those found in sugary drinks. Fortunately, there are many alternatives available. The diet beverage industry has grown tremendously in recent years, offering a variety of sugar-free or low-calorie options. Additionally, many food products are now marketed as “sugar-free” or “reduced sugar,” making it easier to choose healthier options. LNCSB beverages are a great option for those who want to enjoy a sweet taste without consuming a large number of calories.
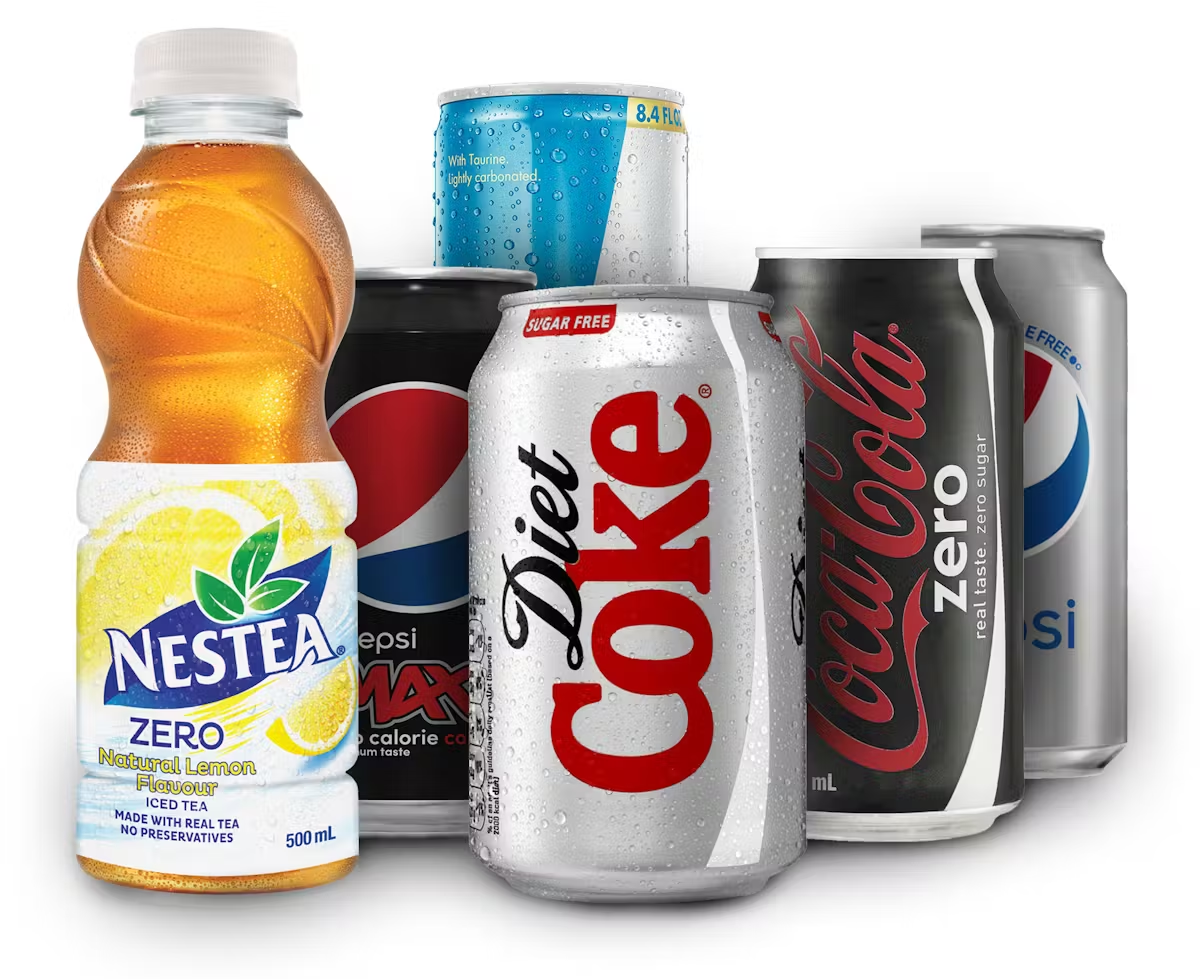
Diet drinks, an umbrella term for zero-calorie beverages (LNCSBs), offer a way to control liquid calorie intake. By avoiding sugary drinks, these options can be helpful for those looking to reduce their overall calorie intake. Diet drinks vary widely, from zero-calorie diet sodas to artificial sweeteners available in food service establishments.
Have you ever wondered what's in those little blue packets you use to sweeten your drinks? The answer is aspartame. This artificial sweetener is a derivative of two amino acids: phenylalanine and aspartate.
One of the most interesting features of aspartame is its incredible potency. Despite containing the same amount of calories as sugar, it is approximately 200 times sweeter. This means that a minuscule amount is needed to achieve the same level of sweetness, making it a popular choice for sweetening diet drinks and other low-calorie products.
It's true that aspartame does contain calories, but the amount is so insignificant that companies aren't required to list it on the label of diet sodas. To give you an idea, most aspartame-sweetened beverages contain about one calorie per 12 ounces (355 ml). A practically negligible amount!
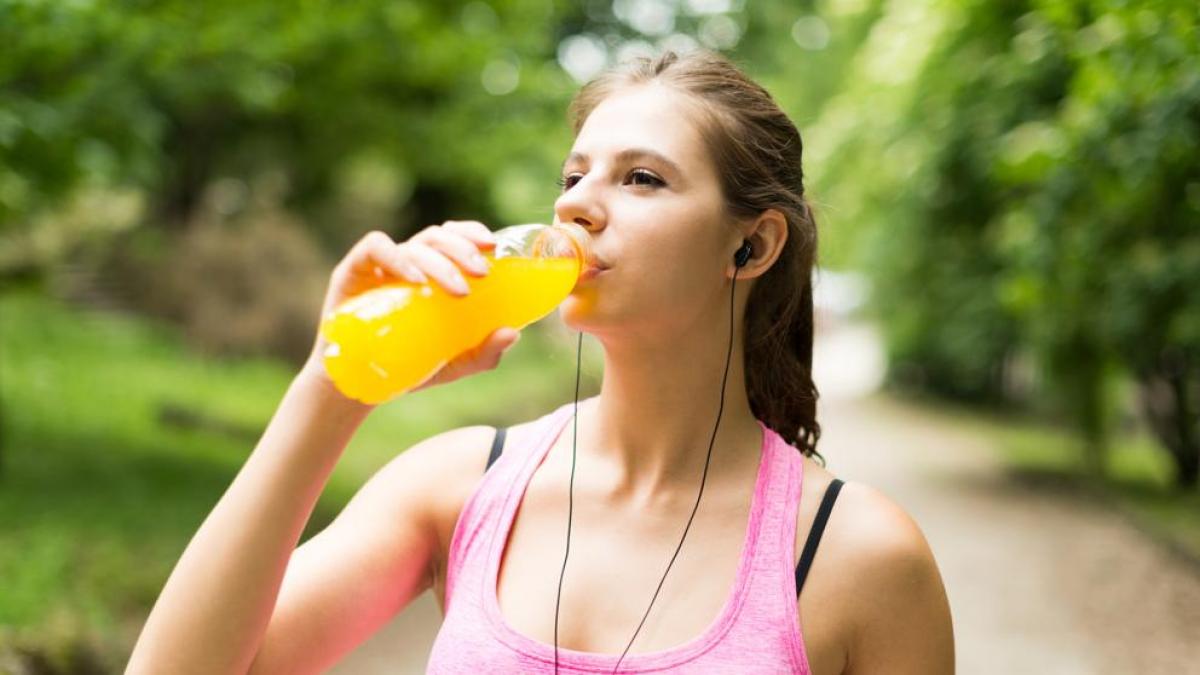
Contrary to popular belief, sugary drinks are not just sodas. They are also found in fruit juices, sports drinks, and other beverages that contain added sugars. These drinks are characterized by low nutritional value. The key difference is that sugary drinks contain calories, while diet drinks do not. However, even diet drinks can add calories if consumed in large portions. Sugary drink consumption in the U.S. has been declining since 2002, possibly driven by the development of dietary alternatives. Despite this reduction, obesity remains a challenge and the U.S. is among the top consumers of sugary drinks globally. Between 2011 and 2014, adults in the United States consumed an average of 145 calories per day from sugary drinks. That's the equivalent of one soda per day! If you replace it with a diet soda four times per week, you could reduce your weekly calorie intake by 580 calories. A great way to lose weight!
Despite the controversy over diet drinks and their impact on body composition, scientific evidence suggests that replacing sugary drinks with diet soda can lead to positive changes in several health metrics, likely due to caloric reduction and subsequent weight loss. However, unsubstantiated claims about the adverse effects of diet soda persist, including the idea that it may cause weight gain through mechanisms without strong evidence, such as increasing insulin or appetite. Despite data supporting the benefits of diet drinks, U.S. dietary guidelines continue to recommend water as the best choice to replace sugary drinks. In fact, many people online, upon learning the data about diet drinks, claim that 'it would be better to just drink water.' This study directly addresses whether water is superior to diet soda for weight loss and improving cardiometabolic risk factors.
Purpose
A network meta-analysis was performed to assess the relationship between diet beverage consumption, body weight, and cardiometabolic risk factors.
Hypothesis
Although they did not formulate a specific hypothesis, the authors presented their research in a way that suggests that diet drinks could be a beneficial option compared to sugary drinks, especially with regard to weight management and cardiometabolic health.
The participants
Seventeen randomised controlled trials (RCTs) were identified that met the inclusion criteria. Participants, who were overweight or obese and at risk or diagnosed with diabetes, had a mean age of 33 years (range: 23–48 years).
Study procedures
Of the 17 trials analysed, 24 comparisons were made to assess the impact of replacing sugary drinks with healthier options. The study focused on three types of substitutions: diet drinks, water and a combination of both.
Trials were compared using various body composition metrics and cardiometabolic risk factors (indicators of heart and metabolic health). Only studies that met the criteria in Table 1 were included.
Table 1 Characteristics of the trials included in the analyses.
Participants | Intervention | Comparison | Measures |
Adult men and women. All health backgrounds. | Diet drink or SSBs or water | Diet drink or SSBs or water | Adiposity, glycemic control, blood lipid targets, blood pressure, non-alcoholic fatty liver, and uric acid. |
SSBs: Sugar-Sweetened Beverages
In this section, we will explore how researchers used sophisticated statistical techniques to analyze data from multiple studies. Traditionally, meta-analyses focus on comparing just two treatments in a study. However, this study takes a broader approach: network meta-analysis.
Imagine we want to compare three types of performance-enhancing supplements: A, B, and C. A traditional meta-analysis might only compare A vs B, or A vs C, etc. But a network meta-analysis allows us to compare them all simultaneously.
How does it work? This technique combines direct evidence (studies that directly compare A vs B, for example) with indirect evidence. Indirect evidence is based on studies that compare A with a third supplement (D) and B with that same supplement D. In this way, we can infer the relationship between A and B, even if there is no study that directly compares them.
Network meta-analysis can be more complex than a traditional pairwise meta-analysis, as it requires strict transitivity assumptions to be met for the data to be valid. Transitivity refers to the absence of systematic differences between comparisons, other than the treatments being compared. Assessing transitivity is critical to ensure that there is no bias in the estimates of treatment effect. Transitivity is considered to be present if there is no overlap between the ranges of pairwise comparisons.
To assess the quality of evidence from the data included in the analysis, the researchers applied a standardized approach known as Grading of Recommendations Assessment, Development, and Evaluation (GRADE). This system, which includes a specific extension for network meta-analysis, allows the level of confidence in the accuracy of a treatment effect to be determined.
In other words, GRADE helps us understand whether the results we see in the data are really reliable. For example, if the data show that drink A reduces body weight more than drink B, but the certainty of the evidence is very low, then we can't be sure that this difference is real. It could be due to errors in the data or other factors.
The GRADE approach assigns a level of certainty to each variable assessed, which can range from "high" (when we are very confident in the accuracy of the data) to "very low" (when we have minimal confidence). All measures of interest started with a "high" GRADE level, and this level was reduced according to a series of established criteria: risk of bias, inconsistency, indirectness, imprecision and publication bias.
To better understand how this system was applied in our analysis, we invite you to consult Table 1. In it you will find key details about each study included in the network meta-analysis, which will allow you to understand how the quality of the evidence was evaluated for each variable and how this influences the interpretation of the results.
Table 2 Characteristics of the 17 RCTs included in this study
Source and Country | Total No. of Participants | LNCS Type | LNCSB | Water | SSB | Design | Duration, wk | Funding Source |
Bonnet et al, 2018: France | 50 (56% Females) | Aspartame or Acesulfame Potassium | 660 | 660 | NA | Crossover | 12 | Agency or Industry |
Bruun et al, 2015: Denmark | 35 (60% Females) | Aspartame | 1000 | 1000 | 1000 | Parallel | 26 | Agency or Industry |
Campos et al, 2015: Switzerland | 27 (52% Males) | NR | 1300 | NA | 1300 | Parallel | 12 | Agency |
Ebbeling et al, 2020; US | 203 (60% Males) | NR | 355 | 355 | 355 | Parallel | 52 | Agency |
Engel et al, 2018: Denmark | 45 (64% Females) | Aspartame | 1000 | 1000 | 1000 | Parallel | 26 | Agency or Industry |
Hernandez-Cordero et al, 2014; Mexicon | 240 (100% Females) | NR | NA | ≥250 | ≥250 | Parallel | 39 | Industry |
Higgins et al, 2018; US | 93 (54% Females) | Aspartame | 500 | 500 | NA | Parallel | 12 | Industry |
Higgins and Mattes, 2019; US | 154 (56% Females) | Saccarin, aspartame, rebaudioside A, or sucralose | 1250-1750 | NA | 1250-1750 | Parallel | 12 | Agency |
Madjd et al, 2015; Iran | 62 (100% Females) | NR | ≥250 | ≥250 | NA | Parallel | 24 | Agency |
Madjd et al, 2017; Iran | 81 (100% Females) | NR | ≥250 | ≥250 | NA | Parallel | 24 | Agency |
Maersk et al, 2012; Denmark | 35 (60% Females) | Aspartame | 1000 | 1000 | 1000 | Parallel | 26 | Agency or Industry |
Peters et al, 2016; US | 308 (83% Females) | NR | 710 | 710 | NA | Parallel | 52 | Industry |
Reid et al, 2007; England | 133 (100% Females) | Aspartame | 1000 | NA | 1000 | Parallel | 4 | Agency |
Reid et al, 2010; Scotland | 53 (100% Females) | Aspartame | 1000 | NA | 1000 | Parallel | 4 | Agency |
Reid et al, 2014; Scotland | 41 (100% Females) | Aspartame | 1000 | NA | 1000 | Parallel | 4 | Agency or Industry |
Tate et al, 2014; Scotland | 213 (52% Males) | NR | 1420-2000 | 1420-2000 | NA | Parallel | 26 | Industry |
Tordoff and Alleva, 1990; US | 30 (70% Males) | Aspartame | 1135 | NA | 1135 | Crossover | 3 | Agency |
Measures
In certain circumstances, the available data were incomplete, leading researchers to resort to improvisation. However, whenever possible, the change from baseline method was applied in each study to determine mean differences (MD) for each beverage substitution and metric evaluated.
As an example, consider the case where one seeks to analyze the impact of replacing a sugary drink with a diet drink on body weight change. In this scenario, one would collect all the relevant data and calculate the average changes in body weight recorded in each study. Then, one would calculate the average of the changes in body weight for each group (diet drink or sugary drink). Finally, one would subtract the two averages obtained to establish the difference in body weight change between the two groups..
The study focused primarily on changes in body weight, but other measures were also used to analyse the participants' body composition. These included body mass index (BMI), which relates weight to height, body fat percentage, which indicates the proportion of fat in the body, and waist circumference, which is an indicator of abdominal fat.
A comprehensive analysis of risk factors associated with cardiovascular and metabolic diseases was performed. This analysis included the measurement and evaluation of various parameters, such as blood glucose control, lipid levels, blood pressure, the presence of non-alcoholic fatty liver disease and uric acid levels.
What did they find?
We will conduct a thorough and objective analysis of the beverages, ensuring the validity of the comparisons to assess their effectiveness in specific measures.
Bias and transitivity
The risk of bias assessment in the 17 studies revealed that 8 of them could not be classified due to lack of information. The researchers encountered difficulties in obtaining additional data from the trial authors, as only two of seven requests were answered. Furthermore, two studies were affected by a high number of dropouts, which also influenced the risk of bias assessment. A study on the effects of sucrose on caloric intake had a dropout rate of eight participants in the treatment group before the first follow-up visit. The authors rule out weight gain as a reason for dropout, as the subjects had not attended the second test session. Instead, they hypothesize that increased satiety from sucrose consumption could explain the dropout.
In the second study, the dropout rate was high, but the reasons did not compromise the validity of the study. Two men dropped out of the study due to the excessive amount of soft drinks they had to consume. Importantly, none of the included studies had a high risk of bias, meaning that there is no reason to doubt the quality of the data. This lack of bias reinforces the confidence in the comparison of the data analysed, which will be addressed below. The validity of the indirect estimates was confirmed by fulfilling the transitivity assumption in all the comparisons made. Fulfilling this assumption is essential, since if it were not fulfilled, the indirect estimates used in the pooled analyses would not be valid, which would affect the interpretation of the observed differences. On the other hand, four trials were found that reported adverse events. However, in all cases, these events were assessed as not related to the interventions studied or as not being of sufficient severity to generate relevant consequences.
Substitutions
Diet drinks vs. sugary drinks
A recent study found that switching from sugary drinks to diet drinks has positive effects on several health aspects. Participants who made this change experienced a decrease in their body weight, body mass index (BMI), fat percentage, and fat accumulation in the liver. These results suggest that diet drinks could be a useful tool to improve metabolic health and reduce the risk of obesity-related diseases. Figure 2 shows detailed data on these changes and the certainty of the evidence supporting them.

Water vs. sugary drinks
The results did not reveal significant differences between the primary and secondary measures. However, a trend in favour of water was observed for most measures. Figure 3 presents a detailed analysis of the mean differences (MD) with their respective 95% confidence intervals (CI), the pooled effect estimates for the measures of interest and the assessment of the certainty of the evidence.

Diet drinks vs. water
Recent research suggests that people who consume diet beverages tend to experience greater weight loss and a more significant decrease in systolic blood pressure compared to those who drink water. However, water was associated with lower levels of HbA1C, an indicator of blood sugar control. Figure 4 below illustrates these results in greater detail, including mean differences and 95% confidence intervals for each measure.

What do the findings mean?
This study presents a rigorous analysis of the relationship between diet beverage consumption and weight loss. The researchers have applied a sound methodology, carefully evaluating the available data, considering potential biases and the strength of the evidence.
The results of this analysis are consistent with previous studies, suggesting that diet drinks could be an effective alternative to sugary drinks in promoting weight loss by reducing caloric intake.
It is important to remember that this study, like many others, shows associations and not direct causal relationships. While the results are promising, additional research is needed to confirm these findings and fully understand the mechanisms involved.
In summary, this study contributes to the growing evidence supporting the use of diet drinks as a useful tool in weight loss strategies, as long as they are used responsibly and as part of an overall healthy lifestyle.
Contrary to expectations, switching from sugary drinks to water did not alter body composition. Surprisingly, diet drinks were associated with greater weight loss, possibly by satisfying sweet cravings, making calorie reduction easier. Studies show that people who are successful at maintaining their weight include diet drinks to control calories. This study does not support the idea of avoiding diet drinks in favor of water.

The results of this analysis should be interpreted with caution. The wide range of changes in body weight observed in the included studies (from loss to gain) indicates a potential heterogeneity in the study designs and measurements performed. This limits the ability to draw definitive conclusions. While a greater weight loss benefit was observed with diet drinks compared to water, it is important to note that most of these drinks are composed primarily of water. Therefore, it cannot be claimed that they are superior to water for weight loss.
How can these findings be applied?
If you're on a diet and craving something sweet, a diet drink can be a good option, especially if you tend to drink sugary beverages. Swapping a regular soda for a diet soda could be enough to kick-start your weight loss journey. You'd be cutting out about 35 grams of carbs a day! Another healthy alternative is unsweetened coffee or tea, which have been shown to improve cardiovascular health.
On the other hand, some people may have difficulty gaining weight, either due to a lack of appetite or feeling full quickly. In these cases, high-calorie beverages can be a useful tool to supplement your diet and achieve your weight goals.
This study provides strong evidence that diet beverages do not have a negative impact on weight, body composition, or cardiometabolic risk factors, as is often claimed. This does not mean that you should consume them, but they can be a useful tool if you choose to do so.
References
Rouse, B., Chaimani, A., & Li, T. (2017). Network meta-analysis: an introduction for clinicians. Internal and emergency medicine, 12(1), 103–111.
Guyatt, G., Oxman, A. D., Akl, E. A., Kunz, R., Vist, G., Brozek, J., Norris, S., Falck-Ytter, Y., Glasziou, P., DeBeer, H., Jaeschke, R., Rind, D., Meerpohl, J., Dahm, P., & Schünemann, H. J. (2011). GRADE guidelines: 1. Introduction-GRADE evidence profiles and summary of findings tables. Journal of clinical epidemiology, 64(4), 383–394.
Puhan, M. A., Schünemann, H. J., Murad, M. H., Li, T., Brignardello-Petersen, R., Singh, J. A., Kessels, A. G., Guyatt, G. H., & GRADE Working Group (2014). A GRADE Working Group approach for rating the quality of treatment effect estimates from network meta-analysis. BMJ (Clinical research ed.), 349, g5630.
Malik, V. S., & Hu, F. B. (2019). Sugar-Sweetened Beverages and Cardiometabolic Health: An Update of the Evidence. Nutrients, 11(8), 1840.
Yeung, A., & Wong, N. (2020). How Does Our Brain Process Sugars and Non-Nutritive Sweeteners Differently: A Systematic Review on Functional Magnetic Resonance Imaging Studies. Nutrients, 12(10), 3010.
Rosinger, A., Herrick, K., Gahche, J., & Park, S. (2017). Sugar-sweetened Beverage Consumption Among U.S. Adults, 2011-2014. NCHS data brief, (270), 1–8.
Miller, P. E., & Perez, V. (2014). Low-calorie sweeteners and body weight and composition: a meta-analysis of randomized controlled trials and prospective cohort studies. The American journal of clinical nutrition, 100(3), 765–777.
Rogers, P. J., Hogenkamp, P. S., de Graaf, C., Higgs, S., Lluch, A., Ness, A. R., Penfold, C., Perry, R., Putz, P., Yeomans, M. R., & Mela, D. J. (2016). Does low-energy sweetener consumption affect energy intake and body weight? A systematic review, inc
Rogers, P. J., & Appleton, K. M. (2021). The effects of low-calorie sweeteners on energy intake and body weight: a systematic review and meta-analyses of sustained intervention studies. International journal of obesity (2005), 45(3), 464–478.
Laviada-Molina, H., Molina-Segui, F., Pérez-Gaxiola, G., Cuello-García, C., Arjona-Villicaña, R., Espinosa-Marrón, A., & Martinez-Portilla, R. J. (2020). Effects of non-nutritive sweeteners on body weight and BMI in diverse clinical contexts: Systematic r
Malik V. S. (2019). Non-sugar sweeteners and health. BMJ (Clinical research ed.), 364, k5005.
Maloney, N. G., Christiansen, P., Harrold, J. A., Halford, J., & Hardman, C. A. (2019). Do low-calorie sweetened beverages help to control food cravings? Two experimental studies. Physiology & behavior, 208, 112500.
Welsh, J. A., Sharma, A. J., Grellinger, L., & Vos, M. B. (2011). Consumption of added sugars is decreasing in the United States. The American journal of clinical nutrition, 94(3), 726–734.
US Departments of Agriculture and Health and Human Services. Scientific Report of the 2015 Dietary Guidelines Advisory Committee. US Departments of Agriculture and Health and Human Services; 2015.
Higgins, KA y Mattes, RD (2019). Un ensayo controlado aleatorizado que contrasta los efectos de 4 edulcorantes bajos en calorías y la sacarosa sobre el peso corporal en adultos con sobrepeso u obesidad. The American journal of clinical nutrition, 109(5), 1288–1301.
Tordoff, MG y Alleva, AM (1990). Efecto del consumo de refrescos endulzados con aspartamo o jarabe de maíz con alto contenido de fructosa sobre la ingesta de alimentos y el peso corporal. The American journal of clinical nutrition, 51(6), 963–969.
Catenacci, VA, Pan, Z., Thomas, JG, Ogden, LG, Roberts, SA, Wyatt, HR, Wing, RR y Hill, JO (2014). Consumo de bebidas azucaradas bajas en calorías o sin calorías en el Registro Nacional de Control de Peso. Obesity (Silver Spring, Maryland), 22(10), 2244–2251
Bhupathiraju, SN, Pan, A., Malik, VS, Manson, JE, Willett, WC, van Dam, RM y Hu, FB (2013). Bebidas con cafeína y sin cafeína y riesgo de diabetes tipo 2. The American journal of clinical nutrition, 97(1), 155–166.
van Dam RM (2008). Consumo de café y riesgo de diabetes tipo 2, enfermedades cardiovasculares y cáncer. Fisiología aplicada, nutrición y metabolismo = Physiologie appliquee, nutrition et metabolice, 33(6), 1269–1283.
Comparte en redes sociales
Recent posts

A bad night's sleep: a reason to stay up even longer?
Creatine Effectiveness: What Does Science Say About Its Benefits?

Does meal timing help you lose fat?

Is your triceps press building muscle or holding you back?

Nutrition tailored to you: based on your genetic profile.
Carbohydrates: the key to an explosive workout.