Nutrition tailored to you: based on your genetic profile.
Author:
Julio Valero
Published on:
4/13/2025

A randomized, double-blind, parallel intervention to evaluate biomarker-based nutrition plans for weight loss: the PREVENTOMICS study
Based on biochemical analysis, Preventomics offers a highly personalized diet. Can this system be an effective tool for maintaining long-term fat loss?
Overview
The study evaluated changes in weight loss, body composition, and various biomarkers resulting from implementing a genetically based diet compared to a diet that followed general recommendations.
Both diet groups showed similar weight loss and other outcomes, suggesting that a personalized diet offered no advantages over a general one.
What value do you place on a personalized diet? Prioritizing a diet aligned with your needs and goals is more advantageous than one based solely on multiple biomarkers. Further research is still needed to support dietary recommendations based on individual genetics.
What's the problem?
The obesity epidemic transcends physical appearance. Its severity lies in the profound cardiometabolic disorders that predispose to chronic diseases such as type 2 diabetes, cardiovascular disease, cancer, non-alcoholic fatty liver disease, kidney disease, and osteoarthritis. While nutritional strategies can mitigate body fat and improve cardiometabolic health, achieving lasting weight loss is a complex challenge, with success rates of less than 50% at one year and 20% at two years, due to multiple physiological, psychological, social, and economic factors.
Social media is full of testimonials about "miracle" diets that supposedly work for each individual. This idea is reinforced by the notion of "eating according to your body type" and the growing promotion of personalized diets based on genetic analysis. While science has identified genetic variations that influence metabolism, and omics technology allows these to be analyzed to create "metatypes," it is still unclear whether specific diets can optimize these factors in a way that is superior to conventional dietary approaches.

This study aimed to investigate whether personalized diets based on genetic and metabolite analysis offered better weight loss results compared to general dietary recommendations. The research was sponsored by Preventomics, a company that (according to its website) promotes individualized nutrition and lifestyle plans to optimize health. These plans are based on personal characteristics such as physical, behavioral, lifestyle traits, genotype, preferences, and physical condition, and are delivered through digital tools (ICT) in the form of behavioral stimuli.
The idea is promising, but is it effective in practice?
Purpose and hypothesis
The objective of this study was to evaluate whether a personalized dietary intervention, implemented through the Preventomics tool, generated more favorable changes in weight loss, body composition, and health indicators compared to a general dietary approach.
What did they try and how?
Participants
A total of 100 eligible participants (men and women) were recruited and randomly assigned to study groups after completing baseline assessments. A dropout rate of 18% resulted in 82 participants completing the intervention. Table 1 summarizes the baseline characteristics of the participants and reasons for dropout. Despite the circumstances, likely influenced by the COVID-19 pandemic, the dropout rate is considered acceptable. Figure 1 illustrates the flow of participants through dietary group assignment.
Table 1 Baseline characteristics of participants
Age range | 18 – 65 y |
Average Age | 45 |
BMI, kg/m2 | > 27 kg/m2 |
Body weight, kg | 65 kg |
Drop out reasons | Personal reasons (n = 4) |
Figure 1 Participant group assignment and flow through study
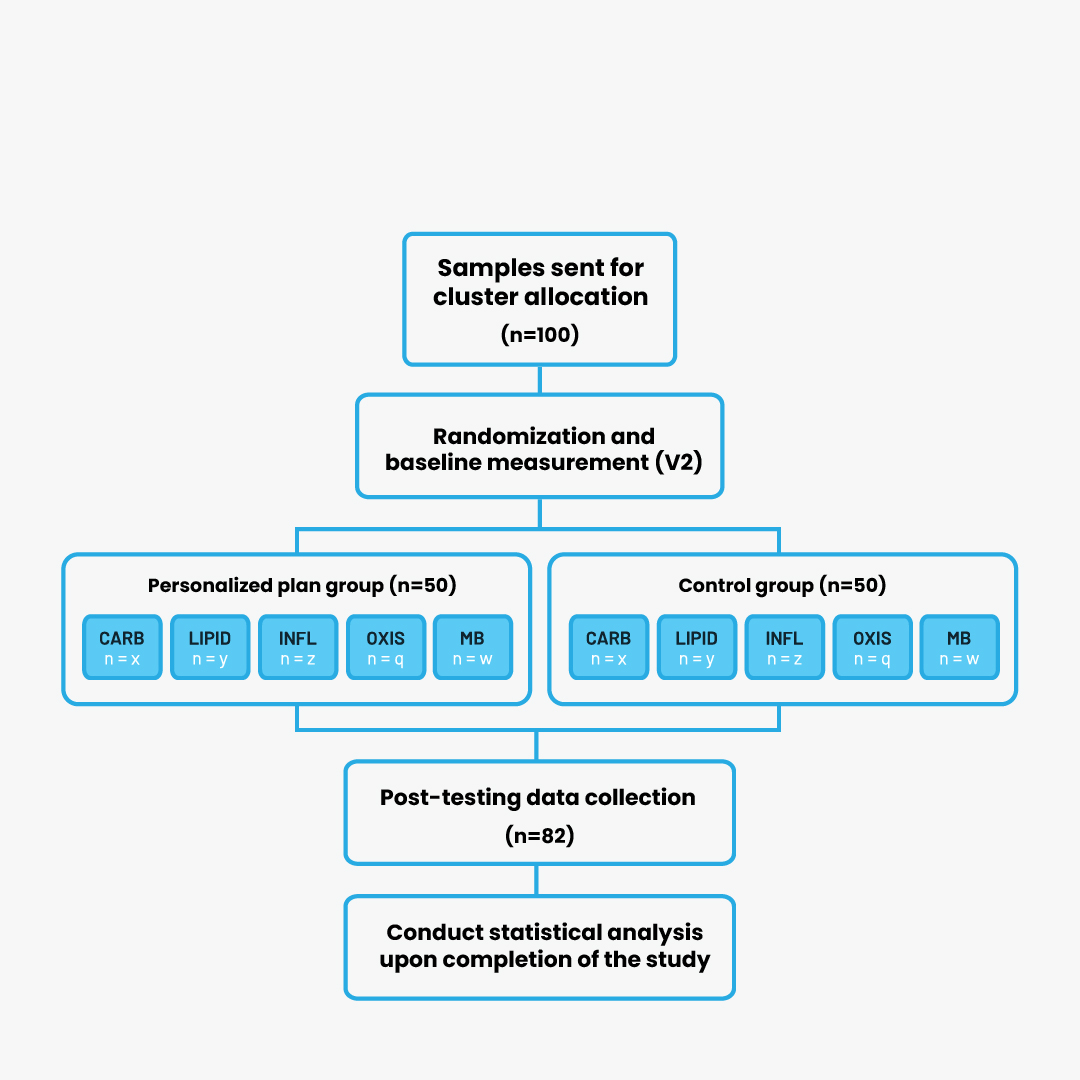
CARB, carbohydrate cluster ; LIPID, lipid cluster; INFL, inflammation cluster; OXIS, oxidative stress cluster; MB, microbiota cluster.
Study procedures
The 10-week protocol required four laboratory visits by participants: first, the screening visit (V0); followed by the pre-baseline visit (V1); then the baseline visit (V2); and finally, the end-of-study visit (V3). In a double-blind, parallel-group design, initial assignment to five dietary groups was based on metabolic and genetic biomarkers obtained at pre-baseline. Participants were then randomized at the baseline visit to either a control or intervention group. A schematic of the study design is presented in Figure 2.
Figure 2 Overview of the study
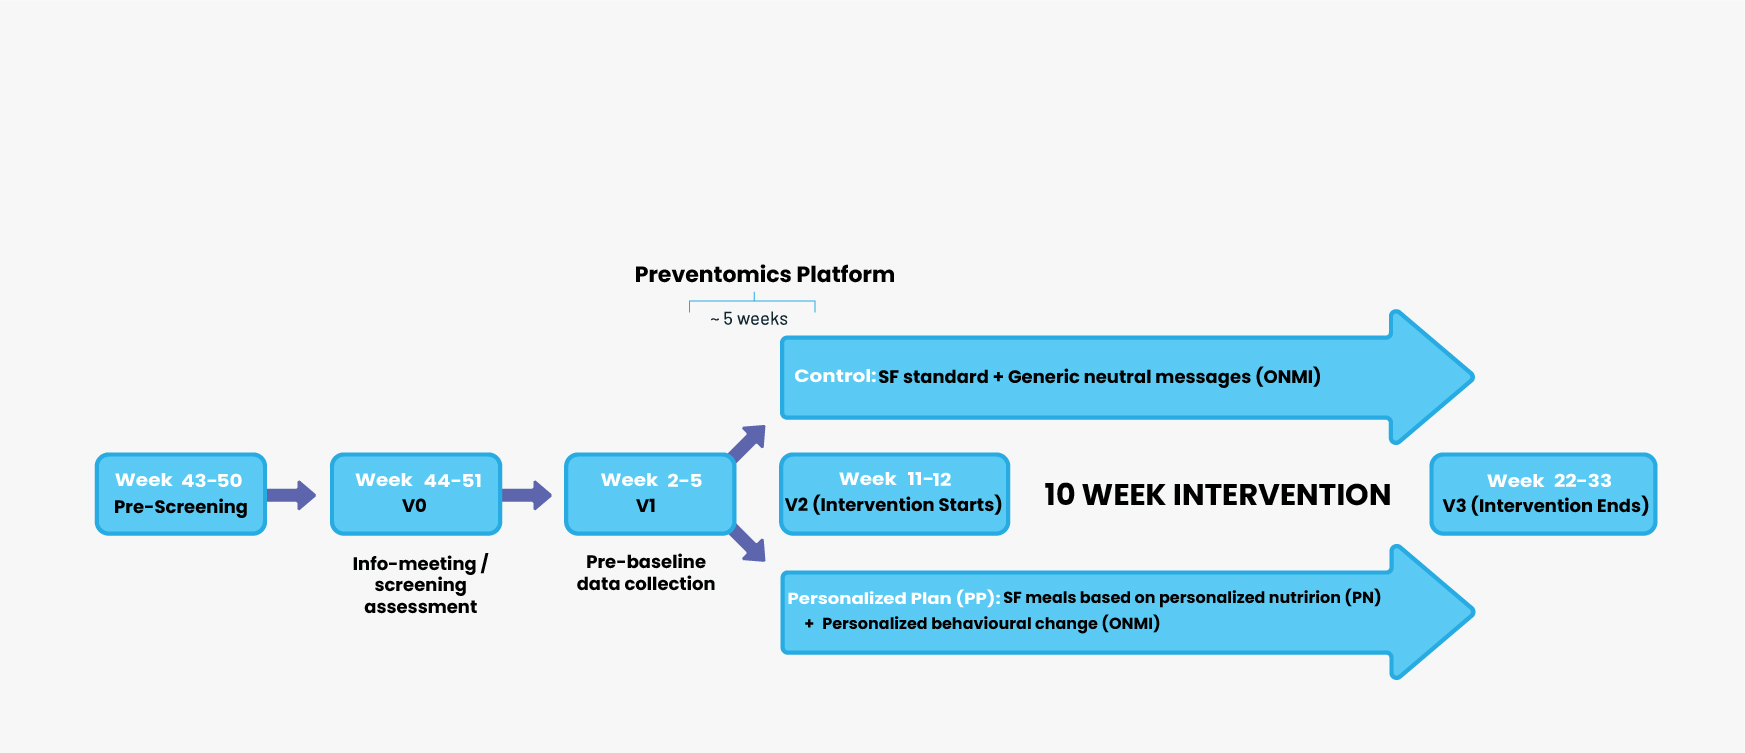
*Approximately 5 weeks from sample submission date for integration of participants' biomarker analysis results into the PREVENTOMICS platform. SF, Simple Feast.
Dietary intervention
Both groups of participants received two weekly deliveries of boxes containing prepared meals for three days (breakfast and dinner), covering 60% of their 21 weekly meals. To ensure consistency with home-prepared meals, they used the Simple Feast app for their Saturday lunches and dinners. The control group followed a general diet, while the intervention group received a personalized diet with ingredient recommendations based on biomarker analysis. Although the diets of both groups were isocaloric, they differed in their specific composition, the details of which are presented in Table 2.
Table 2 Daily targets of macronutrients and functional ingredients in meals provided to participants
Meal: Breakfast + Dinner | Control | Carbohydrate | Microbiota | Lipid | Inflammation | Oxidative Stress |
Energy, kcal | 1200-1500 | 1200-1500 | 1200-1500 | 1200-1500 | 1200-1500 | 1200-1500 |
Protein, % | 10-14 | 10-14 | 10-14 | 10-14 | 10-14 | 10-14 |
Carbohydrate | 45-55 | 45-55 | 45-55 | 45-55 | 45-55 | 45-55 |
Dietary fibre, g | 22-28 | 42-52* | 47-52* | 22-28 | 22-28 | 22-28 |
Added sugars, g | 0 | 0 | 0 | 0 | 0 | 0 |
Fat, % | 30-40 | 30-40 | 30-40 | 30-40 | 30-40 | 30-40 |
Functional Ingredients | ||||||
Fructooligosaccharides and/or inulin | 20g | 20g | ||||
Sunflower oil | 20g | |||||
Turmeric Powder | 6-8g | |||||
Oleic acid enriched sunflower oil | 20g |
Values are presented in ranges (minimum-maximum) for both genders. *Including the functional ingredient.
Behavioral intervention
A positive aspect of the study was the inclusion of a behavioral intervention. Researchers sent two to three push notifications weekly to both groups to promote diet adherence. While the control group received informative, non-personalized messages, the personalized diet group received more specific action notifications. The frequency and intensity of the messages remained similar across groups, differing only in the generality versus specificity of the messages.
Metabolic cluster assignment
Initially, urine and blood samples were collected to analyze 51 biomarkers associated with the main metabolic groups (Table 2). Additionally, 35 single nucleotide polymorphisms (SNPs) in saliva, known to influence these biomarkers, were typed. Integration of SNPs and biomarkers using a proprietary algorithm generated a metabolic score for each group, with each participant being assigned to the group with the highest score.
Table 3 Full list of biomarkers relating to each cluster group
Carbohydrate | Lipid | Inflammation | Oxidative Stress | Microbiota |
Glucose | LDL-cholesterol | CRP | 8-iso-PGF2a | TMA |
HOMA-IR | Total cholesterol | N-acetylglycoproteins | 8-OHdG | TMAO |
Glutamate | PUFAs | MCP-1 | Oxidised LDL | Betaine |
Uric acid | HDL-cholesterol | TNF-a | Uric acid | Choline |
Leptin | SFAs | IL-6 | Allantoin | DMA |
Adiponectin | Triglycerides | IL-10 | Betaine | Dimethylglycine |
Insulin | MUFAs | SFAs | Pseudouridine | LBP |
Tyrosine | LPC | slCAM-1 | Dimethylglycine | Succinate |
Propionylcarnitine | Linoleic acid | LPC | Methionine | Lactate |
Lactate | DHA | LBP | Glycine | Acetate |
Valine | Oleic acid | DHA C20:3 | ||
Leucine | Choline | sCD-14 | ||
Isoleucine | 3-hydroxybutyrate | Linoleic acid C18:2 | ||
Phenylalanine | Propionylcarnitine | PUFAs | ||
Glutamine | Adiponectin | |||
Leptin |
Measures
Weight and body composition analysis: Weight and body composition (lean and fat tissue) were assessed using a digital scale and DXA.
Psychological parameters were assessed through the application of several questionnaires at two time points: at the beginning of the study and at week 10. One of the instruments used was the Three-Factor Eating Questionnaire (TFEQ), a 51-item inventory with broad validity and acceptance, designed to measure cognitive restraint, disinhibition, and hunger in eating behavior.
The Perceived Stress Scale (PSS) stands out as one of the most widely used psychological instruments. This 10-item questionnaire asks participants to indicate their perceived stress level over the past month, using a response scale ranging from 0 to 4.
The EQ-5D-5L instrument measures quality of life considering five key dimensions: movement, self-care, daily tasks, pain/discomfort, and mental health (anxiety/depression).
Obesity and Weight Loss Quality of Life Scale: A 17-item questionnaire on feelings and emotions related to weight, assessed on a seven-point scale to measure the emotional impact of obesity and weight loss attempts.
Dietary Satisfaction Survey (DSat-28): Evaluates 28 aspects grouped into five key dimensions: healthy lifestyle, eating out, cost, food planning and preparation.
Dietary adherence was assessed at the beginning (V1) and end (V3) of the trial using an electronic food frequency questionnaire and a three-day dietary record. Sleep and physical activity were objectively monitored with an accelerometer at pre-study visits and the baseline visit.
Biological samples for analysis: Urine, blood, saliva and feces were collected for the determination of biomarkers and genetic profiles.

What did they find?
Weight loss and body composition
The analysis revealed that changes in body weight (P = 0.77) and fat mass (P = 0.77) were similar between groups. Both groups experienced a weight loss of approximately 3 kg, associated with significant improvements in insulin resistance and lipid profile, with no notable differences between groups. Additionally, significantly greater body weight loss was observed in women than in men.
Dietary intake
Dietary intake was comparable between groups, except for fiber, which was significantly higher (~50 g/day) in the personalized group compared with the control group. Table 4 details the reported differences in dietary intake. Interestingly, both groups significantly decreased their usual protein intake (P < 0.001). No differences in adherence scores were observed between groups, nor were any group-specific differences identified between the personalized and control groups.
Physical activity and psychometrics
The results revealed no significant differences between the groups in physical activity, MVPA, or daily steps. Similarly, no differences were found in changes in PSS and TFEQ between the groups, except for significant increases in food restraint and disinhibition in both groups (p < 0.01).
Table 4 Changes in primary and secondary endpoints in the personalized diet and control diet groups

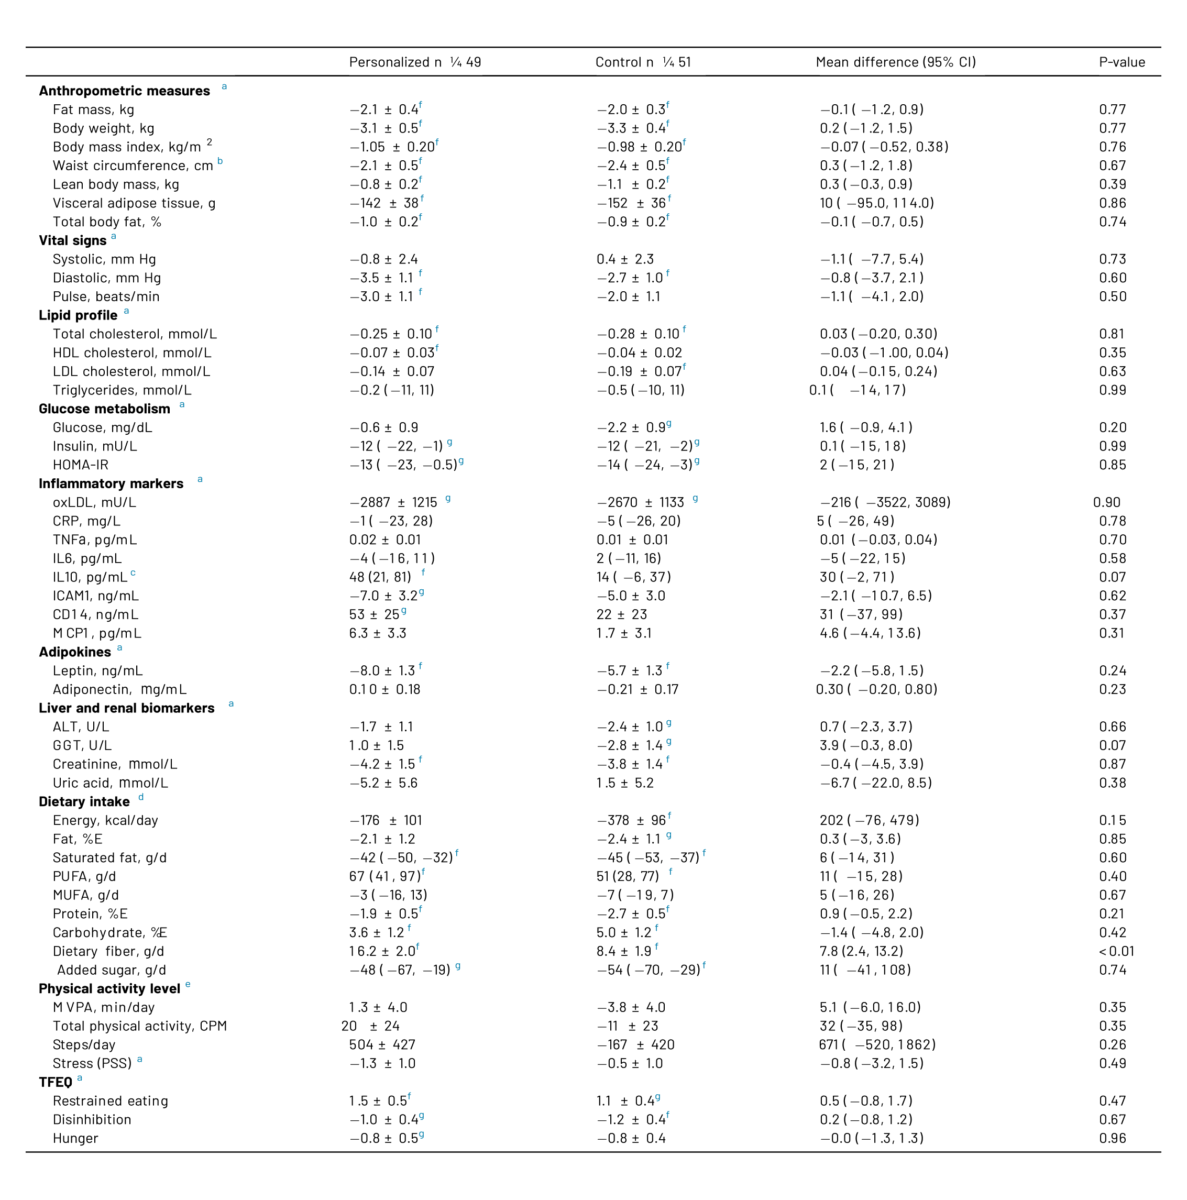
Changes from baseline in each group are presented as means ± SEM based on estimates obtained from linear mixed models with participants as random effect; time, diet group, and their interaction as fixed effects; and sex as covariate. In case of non-normally distributed residuals, log-transformation was performed, and data thus represent mean percent change with 95% CI. Differences between groups in the change from baseline are all shown as means with 95% CIs.
Abbreviations: HDL, high-density lipoprotein; LDL, low-density lipoprotein; oxLDL, oxidized low-density lipoprotein; HOMA-IR, homeostatic model assessment of insulin resistance; CRP, C-reactive protein; TNFa, tumor necrosis factor a; IL6, interleukin 6; IL10, interleukin 10; ICAM1, intercellular adhesion molecule 1; CD14, cluster of differentiation 14; MCP1, monocyte chemoattractant protein 1; ALT, Alanine aminotransferase; GGT, g-glutamyltransferase; PUFA, polyunsaturated fatty acids; MUFA, monounsaturated fatty acids; MVPA, moderate-to-vigorous physical activity; CPM, counts per minute; PSS, perceived stress scale; TFEQ, three factor eating questionnaire.
a Observed (n . 182), estimated (n . 200).
b Observed data (n . 181), estimated (n . 200).
c Observed data (n . 180), estimated (n . 198).
d Observed data (n . 179), estimated (n . 200).
e Observed data (n . 177), estimated (n . 200).
f p < 0.01 significant change from baseline.
g p < 0.05 significant change from baseline.
What do the findings mean?
While the personalized diet group experienced significant weight and body fat loss, as well as improvements in cardiometabolic markers, these benefits did not surpass those observed in the generic dietary advice group. In fact, the differences between the two groups were minimal, limited to a higher fiber intake in the personalized group. No significant changes were found in weight loss, fat loss, anthropometric measurements, or most of the more than 20 metabolic markers, including lipids, glucose, inflammation, adipokines, and liver/kidney function. Surprisingly, there were also no differences in physical activity or dietary behavior. Nonsignificant trends were observed in IL-10 (greater improvement in the control group) and GGT (lower levels in the personalized group), but given the absence of differences in other related markers, their relevance seems limited.
The lack of differences between groups could be due to the fact that baseline obesity makes any healthy diet provide substantial benefits. Another possibility is that our current knowledge of biomarkers does not allow for determining the optimal diet individually, which calls into question the accuracy of grouping. Perhaps future advances in data and understanding will allow for more effective personalized dietary assignment. Finally, the magnitude of the data may be insufficient to generate significant differences, with consistency and a caloric deficit with adequate intake of key nutrients being most relevant to dietary success.
While the current study is not the only one exploring personalized diets based on SNPs and biomarkers, the DIETFITS trial is a relevant example. It compared low-carbohydrate and low-fat diets (with protein and calories matched) over 12 months in obese adults, assessing their impact on weight loss, fat loss, and metabolic markers. Uniquely, DIETFITS investigated the interaction between diet type and both genotype and basal insulin secretion to determine whether these factors influenced outcomes. Contrary to hypothesis, no significant differences were found between dietary groups for most outcomes, nor was there an effect of genotype or insulin, nor any interaction with diet type. These findings are consistent with other studies that have failed to demonstrate benefits of personalized nutrition based on genes or metabolites. However, isolated research suggests that dietary composition may influence fat loss in normoglycemic individuals and weight loss in prediabetics. Overall, the evidence points to minimal or no differences between personalized and general nutritional recommendations regarding weight loss and health outcomes.
This study has several methodological strengths that reinforce confidence in its results. The double-blind design minimized bias, while adequate statistical power ensured the ability to detect significant effects on the main variables. The provision of 60% of meals and the behavioral intervention implemented favored high adherence to the protocol. While limitations such as sample size, study duration, and partial food provision are inherent to clinical research, it is unlikely that overcoming them would have substantially altered the conclusions obtained.
How can we apply these findings?
Our findings support our previous communication on "optimal diets." In comparisons of isocaloric diets, none has consistently been shown to be superior in weight loss, fat loss, cardiometabolic health, adherence, or other physiological or psychological parameters. The key to lasting dietary success lies in consistency. Therefore, the choice of dietary plan should be based on long-term sustainability for each individual.
The full application of knowledge about SNPs and biomarkers to design personalized nutritional plans that are significantly more effective than general dietary recommendations is not yet a reality. Therefore, we recommend caution when considering investments in the field of personalized nutrition based on genetic or biomarker analysis, given its current stage of development. However, we remain hopeful about future progress toward more individualized nutritional strategies.
References
Aldubayan, M. A., Pigsborg, K., Gormsen, S., Serra, F., Palou, M., Galmés, S., Palou-March, A., Favari, C., Wetzels, M., Calleja, A., Rodríguez Gómez, M. A., Castellnou, M. G., Caimari, A., Galofré, M., Suñol, D., Escoté, X., Alcaide-Hidalgo, J. M., M Del Bas, J., Gutierrez, B., Krarup, T., … Magkos, F. (2022). A double-blinded, randomized, parallel intervention to evaluate biomarker-based nutrition plans for weight loss: The PREVENTOMICS study. Clinical nutrition (Edinburgh, Scotland), 41(8), 1834–1844.
Leitner, D. R., Frühbeck, G., Yumuk, V., Schindler, K., Micic, D., Woodward, E., & Toplak, H. (2017). Obesity and Type 2 Diabetes: Two Diseases with a Need for Combined Treatment Strategies - EASO Can Lead the Way. Obesity facts, 10(5), 483–492.
Powell-Wiley, T. M., Poirier, P., Burke, L. E., Després, J. P., Gordon-Larsen, P., Lavie, C. J., Lear, S. A., Ndumele, C. E., Neeland, I. J., Sanders, P., St-Onge, M. P., & American Heart Association Council on Lifestyle and Cardiometabolic Health; Council on Cardiovascular and Stroke Nursing; Council on Clinical Cardiology; Council on Epidemiology and Prevention; and Stroke Council (2021). Obesity and Cardiovascular Disease: A Scientific Statement From the American Heart Association. Circulation, 143(21), e984–e1010.
De Pergola, G., & Silvestris, F. (2013). Obesity as a major risk factor for cancer. Journal of obesity, 2013, 291546.
Li, L., Liu, D. W., Yan, H. Y., Wang, Z. Y., Zhao, S. H., & Wang, B. (2016). Obesity is an independent risk factor for non-alcoholic fatty liver disease: evidence from a meta-analysis of 21 cohort studies. Obesity reviews : an official journal of the International Association for the Study of Obesity, 17(6), 510–519.
Wickman, C., & Kramer, H. (2013). Obesity and kidney disease: potential mechanisms. Seminars in nephrology, 33(1), 14–22.
Carman, W. J., Sowers, M., Hawthorne, V. M., & Weissfeld, L. A. (1994). Obesity as a risk factor for osteoarthritis of the hand and wrist: a prospective study. American journal of epidemiology, 139(2), 119–129.
Hall, K. D., & Kahan, S. (2018). Maintenance of Lost Weight and Long-Term Management of Obesity. The Medical clinics of North America, 102(1), 183–197.
Maclean, P. S., Bergouignan, A., Cornier, M. A., & Jackman, M. R. (2011). Biology's response to dieting: the impetus for weight regain. American journal of physiology. Regulatory, integrative and comparative physiology, 301(3), R581–R600.
Spreckley, M., Seidell, J., & Halberstadt, J. (2021). Perspectives into the experience of successful, substantial long-term weight-loss maintenance: a systematic review. International journal of qualitative studies on health and well-being, 16(1), 1862481.
Ruchat, S. M., Elks, C. E., Loos, R. J., Vohl, M. C., Weisnagel, S. J., Rankinen, T., Bouchard, C., & Pérusse, L. (2009). Association between insulin secretion, insulin sensitivity and type 2 diabetes susceptibility variants identified in genome-wide association studies. Acta diabetologica, 46(3), 217–226.
Mizuta, E., Kokubo, Y., Yamanaka, I., Miyamoto, Y., Okayama, A., Yoshimasa, Y., Tomoike, H., Morisaki, H., & Morisaki, T. (2008). Leptin gene and leptin receptor gene polymorphisms are associated with sweet preference and obesity. Hypertension research : official journal of the Japanese Society of Hypertension, 31(6), 1069–1077.
Tabaeian, S. P., Mahmoudi, T., Sabzikarian, M., Rezamand, G., Dabiri, R., Nobakht, H., Asadi, A., Farahani, H., Mansour-Ghanaei, F., & Zali, M. R. (2021). The Leu72Met (rs696217 G>T) Polymorphism of the Ghrelin Gene Might Be a Protective Factor for Nonalcoholic Fatty Liver Disease. Journal of gastrointestinal and liver diseases : JGLD, 30(2), 233–239.
Gueorguiev, M., Lecoeur, C., Meyre, D., Benzinou, M., Mein, C. A., Hinney, A., Vatin, V., Weill, J., Heude, B., Hebebrand, J., Grossman, A. B., Korbonits, M., & Froguel, P. (2009). Association studies on ghrelin and ghrelin receptor gene polymorphisms with obesity. Obesity (Silver Spring, Md.), 17(4), 745–754.
Lavebratt, C., Rydén, M., Schalling, M., Sengul, S., Ahlberg, S., & Hoffstedt, J. (2002). The hormone-sensitive lipase i6 gene polymorphism and body fat accumulation. European journal of clinical investigation, 32(12), 938–942.
Tsuboi, H., Sakakibara, H., Yamakawa-Kobayashi, K., Tatsumi, A., Inamori, T., Hamamoto, R., Suzuki, A., y Shimoi, K. (2011). El polimorfismo Val1483Ile en el gen de la sintetasa de ácidos grasos se asoció con síntomas depresivos bajo la influencia del estrés psicológico. Journal of affective diseases, 134(1-3), 448–452.
Inicio - Preventomics, Sistema basado en biomarcadores para asesoramiento personalizado. Preventomics. (13 de junio de 2022).
Comparte en redes sociales
Recent posts

A bad night's sleep: a reason to stay up even longer?

Creatine Effectiveness: What Does Science Say About Its Benefits?

Does meal timing help you lose fat?

Is your triceps press building muscle or holding you back?
Nutrition tailored to you: based on your genetic profile.

Carbohydrates: the key to an explosive workout.